|

BOAT/MOTOR
SALES/SERVICE
Statesboro, GA

FISHING CHARTERS
Savannah, GA


INFORMATION SITES

3D Views of the Georgetown Hole
|
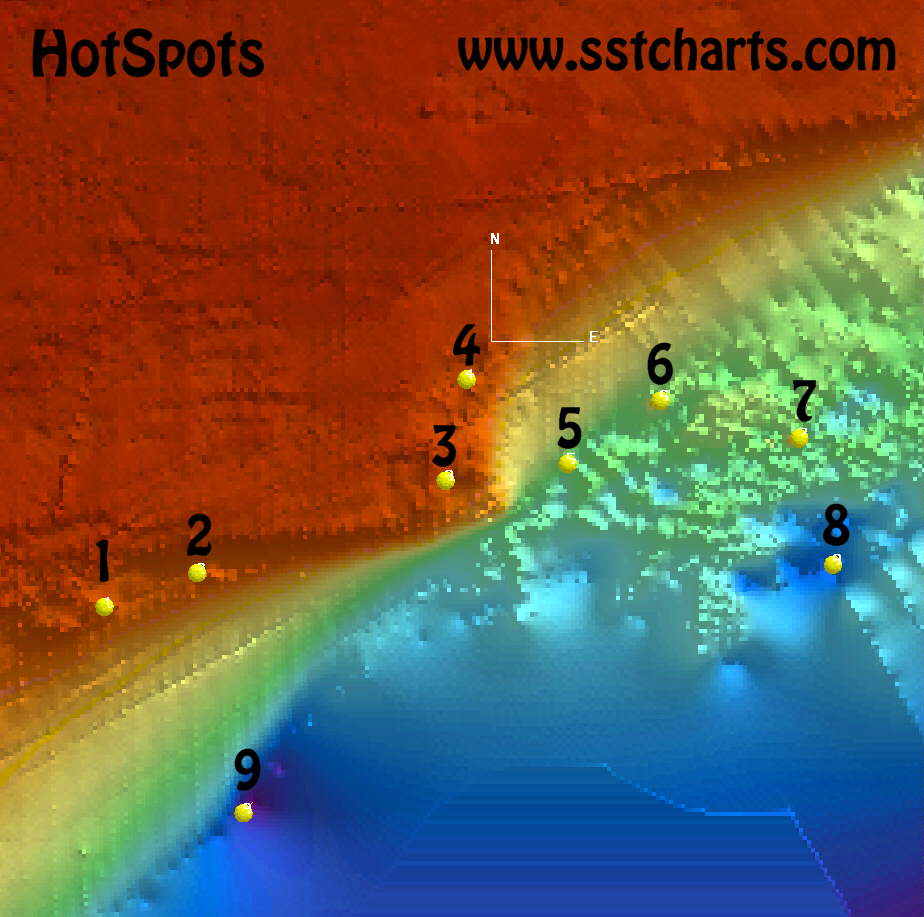
This image is a shaded bathymetric contour of the Georgetown Hole area created using HotSpots Charts, LLC 3D software. Dark red
represents the shallowest depths, dark blue the deepest.
When a backflow of Gulf Stream water is pushing over this area
from the northeast, good upwhellings will occur along the ledge
between points 3 and 4. When the Gulf Stream flows directly over the
area from the south, upwhellings will occur between points 2 and 3.
|
Left click on image to view full screen.
|
| Point |
Latitude |
Longitude |
| 1 |
3229.900 |
7847.850 |
| 2 |
3231.100 |
7844.550 |
| 3 |
3234.400 |
7835.700 |
| 4 |
3238.000 |
7834.950 |
| 5 |
3235.000 |
7831.350 |
| 6 |
3237.250 |
7828.050 |
| 7 |
3235.900 |
7823.100 |
| 8 |
3231.400 |
7821.900 |
| 9 |
3222.550 |
7842.900 |
|
|
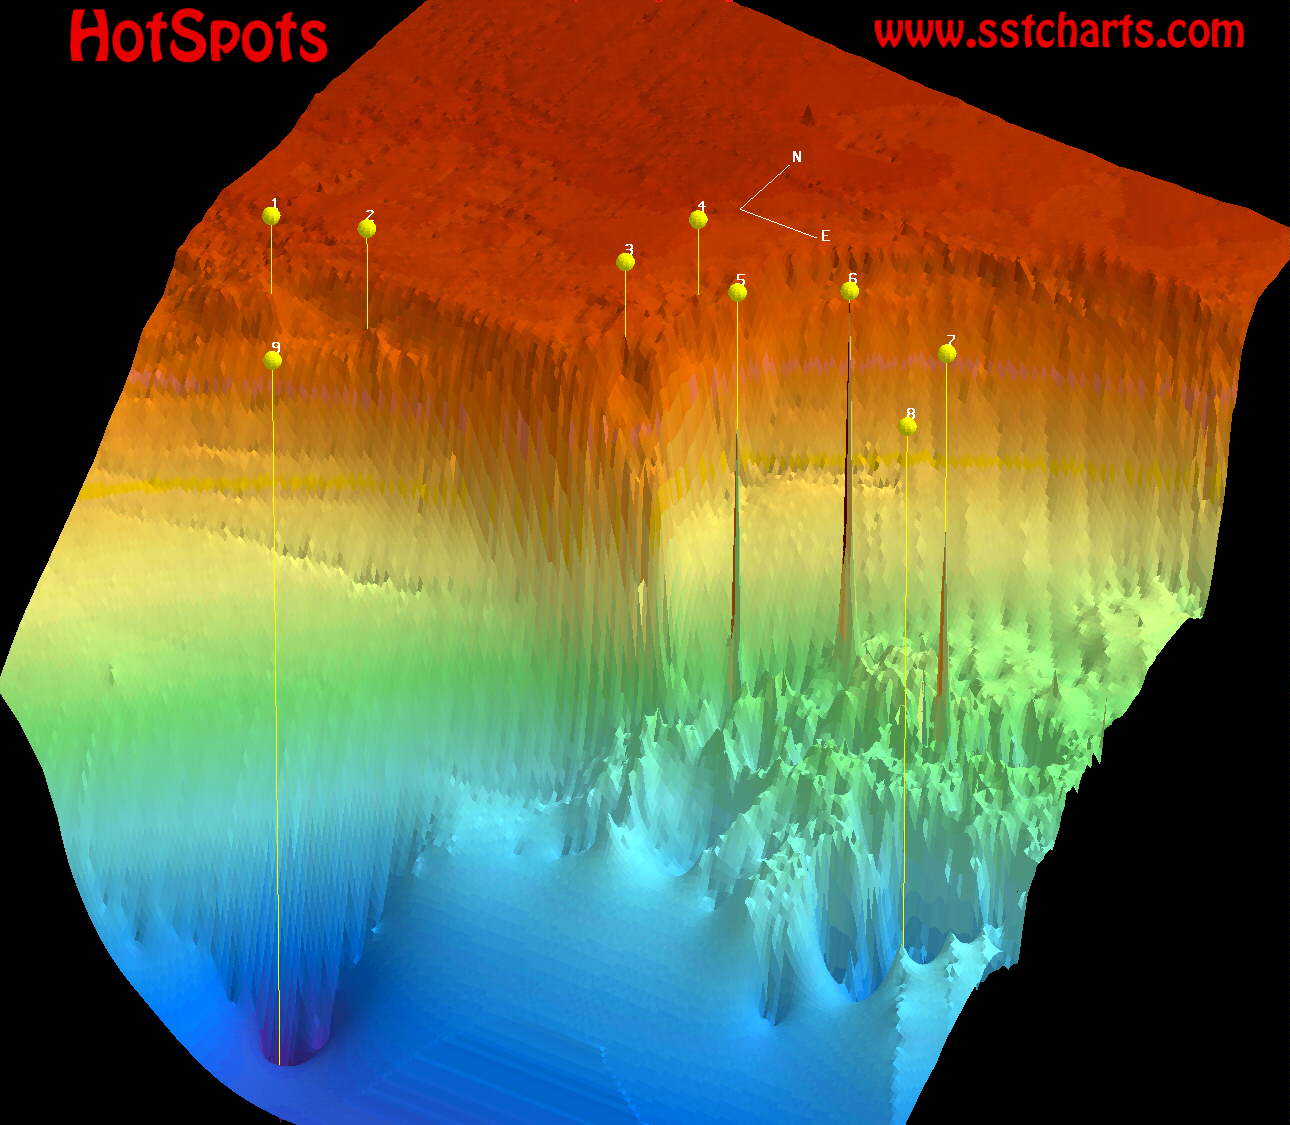
This image is a three-dimensional shaded bathymetric contour of the
Georgetown Hole area created using HotSpots Charts, LLC 3D software. Dark red
represents the shallowest depths, dark blue the deepest.
Points 5, 6, and 7, listed above, are shown here to be humps.
These humps can cause upwhellings regardless of the direction of the
Gulf Stream. Points 8 and 9 are depressions.
|
Left click on image to view full screen.
|
|
|
|
|
|
|
|
|
|


 E-Mail HotSpots Charts, LLC